
KEY HIGHLIGHTS
- New York scores just 7.23 out of 100 on the Rollover Danger Index.
- With only 15.8 fatal interstate rollover crashes per year, New York records fewer deaths than every comparable high-VMT state, including Ohio (35.6), Georgia (48.4), and Tennessee (45.0), despite carrying similar or greater traffic volumes.
- New York’s fatal rollover rate of 0.014 per 100 million VMT is 3.69 times safer than the national average, outperforming 48 of 50 states and running over 2.5 times safer than neighboring Pennsylvania on the same interstate network.
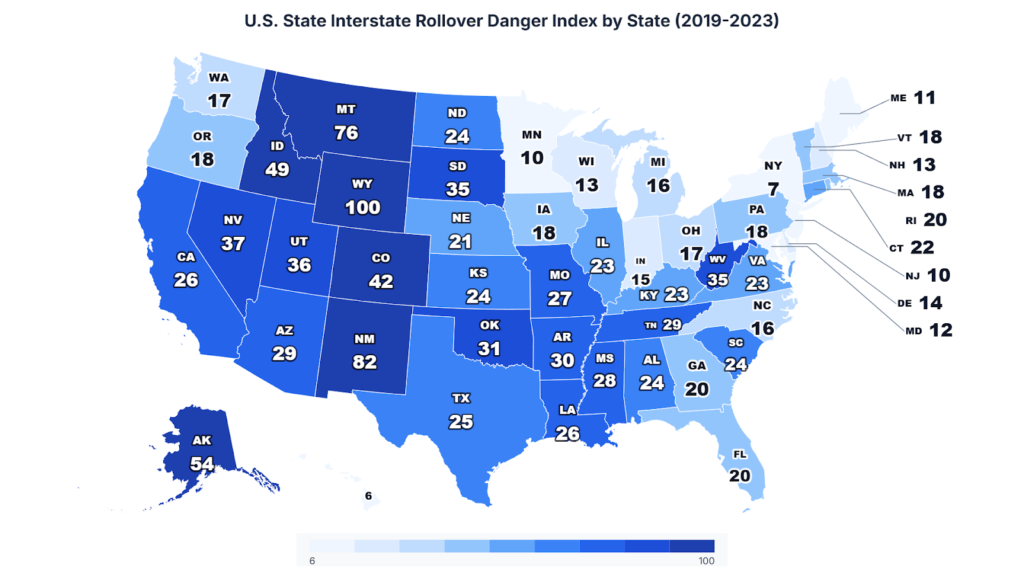
Across five years of federal crash records, New York averaged just 15.8 fatal interstate rollover crashes annually while carrying 113,756 million vehicle miles of traffic. The state’s Rollover Danger Index score of 7.23 out of 100 places it among the most exceptional road safety performers in the country.
The study conducted by Grigor Law Injury & Car Accident Lawyers draws on National Highway Traffic Safety Administration Fatality Analysis Reporting System records from 2019 to 2023 for interstate rollover crashes. Rates use Federal Highway Administration vehicle-miles-traveled data to rank states from safest to most dangerous.
New York Among the Ten Safest States Nationally
| Rank | State | Fatal Rollover Rate per 100M VMT | Total Crashes (2019-2023) |
| 1 | Hawaii | 0.01 | 6 |
| 2 | New York | 0.01 | 79 |
| 3 | New Jersey | 0.02 | 68 |
| 4 | Minnesota | 0.02 | 53 |
| 5 | Maine | 0.02 | 15 |
| 6 | Maryland | 0.02 | 65 |
| 7 | Wisconsin | 0.03 | 81 |
| 8 | New Hampshire | 0.03 | 17 |
| 9 | Delaware | 0.03 | 13 |
| 10 | Indiana | 0.03 | 117 |
New York’s precise rate of 0.01389 places it second nationally, just behind Hawaii at 0.01188, with New Jersey trailing at 0.01830. Seventy-nine fatal crashes across five years on one of America’s most heavily traveled networks is an outcome no comparable state matches. Indiana, at rank 10, recorded 117 crashes over the same period on a lower annual volume.
New York vs. Comparable High-Traffic States
| State | Annual VMT (millions) | Avg Annual Fatal Rollovers | Fatal Rate per 100M VMT | Danger Index (out of 100) |
| New York | 113,756 | 15.8 | 0.014 | 7.23 |
| North Carolina | 117,638 | 36.2 | 0.031 | 16.01 |
| Ohio | 110,907 | 35.6 | 0.032 | 16.70 |
| Michigan | 95,931 | 29.8 | 0.031 | 16.16 |
| Pennsylvania | 98,714 | 35.0 | 0.035 | 18.45 |
| Illinois | 101,160 | 43.8 | 0.043 | 22.53 |
| Virginia | 82,291 | 36.2 | 0.044 | 22.89 |
| Tennessee | 81,701 | 45.0 | 0.055 | 28.66 |
| Georgia | 124,998 | 48.4 | 0.039 | 20.15 |
No state with comparable interstate traffic volume comes close to New York’s performance. Georgia carries slightly more traffic at 124,998 million VMT per year, but records over three times as many fatal rollover crashes annually. Tennessee, running 81,701 million VMT; roughly 28 percent less than New York, averages 45 fatalities per year compared to New York’s 15.8.
Looking at the Study, Chrissy Grigoropoulos, Founder of Grigor Law Injury & Car Accident Lawyers, commented:
“New York’s Danger Index score of 7.23 is not a minor improvement on the national average; it is a structural outlier. Most states in the 80,000-to-130,000 VMT range score between 16 and 29 on the index. New York scores more than twice as low as its nearest comparable peer. That gap is too consistent and too wide to be coincidental.“
New York Anchors a Strong Northeast Region
| State | National Rank | Fatal Rate per 100M VMT | Total Crashes (2019–2023) | Danger Index (out of 100) |
| New York | 2 | 0.014 | 79 | 7.23 |
| New Jersey | 3 | 0.018 | 68 | 9.52 |
| Maine | 5 | 0.021 | 15 | 10.83 |
| New Hampshire | 8 | 0.026 | 17 | 13.46 |
| Massachusetts | 16 | 0.035 | 103 | 18.12 |
| Vermont | 17 | 0.035 | 12 | 18.21 |
| Rhode Island | 20 | 0.038 | 14 | 19.65 |
| Pennsylvania | 19 | 0.035 | 175 | 18.45 |
| Connecticut | 24 | 0.043 | 65 | 22.46 |
New York’s index score of 7.23 is 52 percent lower than the next-best Northeast state, New Jersey, at 9.52. The gap widens sharply from there: Pennsylvania, which shares long stretches of shared corridor traffic with New York, scores 18.45, over 2.5 times higher, despite carrying less interstate traffic.
New York vs. The Ten Most Dangerous States
| State | National Rank | Fatal Rate per 100M VMT | Total Crashes (2019–2023) | Danger Index (out of 100) |
| New York | 2 (Safest) | 0.014 | 79 | 7.23 |
| West Virginia | 41 | 0.067 | 55 | 34.69 |
| South Dakota | 42 | 0.068 | 34 | 35.26 |
| Utah | 43 | 0.069 | 114 | 35.79 |
| Nevada | 44 | 0.071 | 97 | 36.97 |
| Colorado | 45 | 0.081 | 215 | 42.10 |
| Idaho | 46 | 0.095 | 89 | 49.45 |
| Alaska | 47 | 0.103 | 29 | 53.82 |
| Montana | 48 | 0.146 | 96 | 76.03 |
| New Mexico | 49 | 0.157 | 209 | 81.54 |
| Wyoming | 50 (Most Dangerous) | 0.192 | 96 | 100.00 |
Measured against the nation’s ten most dangerous states, New York’s safety margin is striking. Wyoming’s Danger Index of 100,the benchmark for worst performance, is nearly 14 times higher than New York’s 7.23. New Mexico at 81.54 and Montana at 76.03 are both more than ten times higher.
Methodology
This analysis used the National Highway Traffic Safety Administration Fatality Analysis Reporting System to identify all fatal crashes from 2019 through 2023 on Interstate Highway System routes involving a rollover. Interstate vehicle miles traveled for the same period were sourced from FHWA Highway Statistics and averaged across the five-year window. The primary metric, fatal interstate rollover crash rate per 100 million VMT, was calculated as average annual fatal crashes divided by average annual VMT multiplied by 100,000,000. All 50 states are ranked 1 (safest) to 50 (most dangerous) on this basis.
Data Sources
• NHTSA Fatality Analysis Reporting System (FARS): https://cdan.dot.gov/query
• Research Dataset: https://docs.google.com/spreadsheets/d/1dsRMM6jJPL84nqZcjyLzuWXFmVotuQKIxVMkG-R012U/edit?usp=sharing
• Study By: https://grigorlaw.com/
About Grigor Law Injury & Car Accident Lawyers
Grigor Law Injury & Car Accident Lawyers is New York’s premier all-injury law firm, focusing on car crashes and serious injury cases. The firm pairs courtroom experience with independent traffic safety research to inform the public and support safer roads.

