
KEY HIGHLIGHTS
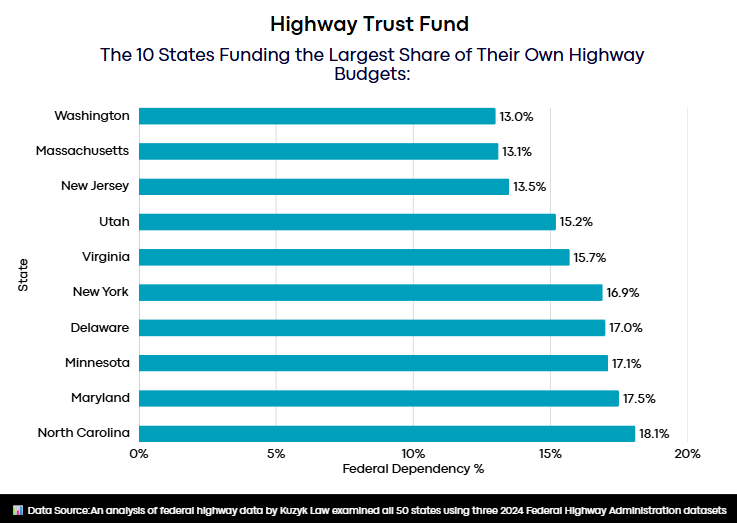
- New Jersey is the third-most self-funded state in America for highway funding. Just 13.5% of the state’s $9.75 billion highway budget comes from federal sources.
- New Jersey’s own drivers and vehicle owners generate $3.35 billion in state highway-user revenue, 2.5 times the federal funds the state receives.
- For every $1.00 New Jersey’s highway users pay into the federal Highway Trust Fund, the state receives $1.36 back.
New Jersey’s 38,778 miles of public roads carry some of the heaviest traffic volumes in the nation, serving roughly 9.3 million residents in the most densely populated state. Toll revenues and state fees allow New Jersey to fund over 86% of its highway budget independently.
An analysis of federal highway data by Kuzyk Personal Injury & Car Accident Lawyers examined all 50 states using three 2024 Federal Highway Administration datasets: FHWA Table SF-1 (revenues used by states for highways), FHWA Table FE-9 (Highway Trust Fund receipts attributable to highway users in each state), and FHWA Table HM-20 (public road length by functional system). The study compared federal funds received by each state against what each state’s highway users contribute to the federal Highway Trust Fund, alongside state highway-user revenues and public road mileage.
Table 1: 10 States That Fund the Largest Share of Their Own Highway Budgets
| Rank | State | Federal Dependency % | State Highway-User Revenue |
| 1 | Washington | 13.0% | $2.44B |
| 2 | Massachusetts | 13.1% | $1.10B |
| 3 | New Jersey | 13.5% | $3.35B |
| 4 | Utah | 15.2% | $850.7M |
| 5 | Virginia | 15.7% | $2.52B |
| 6 | New York | 16.9% | $5.84B |
| 7 | Delaware | 17.0% | $841.9M |
| 8 | Minnesota | 17.1% | $1.89B |
| 9 | Maryland | 17.5% | $1.60B |
| 10 | North Carolina | 18.1% | $4.14B |
New Jersey ranks third among the states that fund the largest share of their own highway budgets, with just 13.5% of its highway spending coming from federal sources. The least federally dependent states are a mix of large, high-revenue states and smaller states that generate substantial per-capita highway income through tolls and fees.
Table 2: New Jersey vs. Northeast and Mid-Atlantic Neighbors
| Rank | State | Fed Dep % | Donor Ratio | State Hwy-User Rev | Fed $/Mile | Road Miles |
| 2 | Massachusetts | 13.1% | 1.41x | $1.10B | $23,855 | 36,931 |
| 3 | New Jersey | 13.5% | 1.36x | $3.35B | $33,991 | 38,778 |
| 6 | New York | 16.9% | 1.33x | $5.84B | $17,653 | 116,320 |
| 7 | Delaware | 17.0% | 2.54x | $841.9M | $45,834 | 6,695 |
| 9 | Maryland | 17.5% | 1.14x | $1.60B | $22,903 | 32,669 |
| 16 | Connecticut | 21.5% | 1.99x | $1.01B | $34,212 | 21,472 |
| 19 | Pennsylvania | 23.0% | 1.69x | $4.89B | $19,697 | 121,430 |
Among its Northeast and Mid-Atlantic neighbors, New Jersey’s 13.5% federal dependency is the lowest after Massachusetts (13.1%). New Jersey’s federal spending per road mile ($33,991) is the second-highest in the group after Delaware ($45,834), reflecting the cost of maintaining infrastructure in the most densely populated state.
Table 3: States Where Federal Highway Funds Exceed State Highway-User Revenue
| Rank | State | Federal Funds Received | State Hwy-User Revenue | Federal-to-State Ratio |
| 1 | Alaska | $714.2M | $84.4M | 8.47x |
| 2 | Wyoming | $511.8M | $127.3M | 4.02x |
| 3 | Rhode Island | $424.8M | $166.4M | 2.55x |
| 4 | Montana | $644.7M | $289.6M | 2.23x |
| 5 | Louisiana | $1.25B | $601.2M | 2.08x |
| 6 | South Dakota | $638.2M | $342.2M | 1.87x |
| 7 | Vermont | $355.0M | $234.3M | 1.52x |
| 8 | North Dakota | $569.6M | $377.9M | 1.51x |
| 9 | Arkansas | $1.10B | $741.9M | 1.48x |
| 10 | Mississippi | $763.7M | $608.2M | 1.26x |
| 11 | Arizona | $1.12B | $950.0M | 1.17x |
| 12 | Nebraska | $560.2M | $521.3M | 1.07x |
| 13 | Missouri | $1.42B | $1.32B | 1.07x |
Only 13 states receive more in federal highway funds than they collect from their own drivers and vehicle owners. New Jersey is not among them, its $3.35 billion in state highway-user revenue far exceeds the $1.32 billion it receives in federal funds.
Table 4: New Jersey’s Highway Trust Fund Return vs. Top 10 States by Donor Ratio
| Rank | State | Donor Ratio | Federal Funds Received | HTF Contribution |
| 1 | Alaska | 5.67x | $714.2M | $126.1M |
| 2 | Vermont | 4.81x | $355.0M | $73.8M |
| 3 | Rhode Island | 4.34x | $424.8M | $98.0M |
| 4 | South Dakota | 3.44x | $638.2M | $185.7M |
| 5 | Montana | 3.10x | $644.7M | $207.7M |
| 6 | North Dakota | 3.02x | $569.6M | $188.8M |
| 7 | Wyoming | 2.63x | $511.8M | $194.4M |
| 8 | Hawaii | 2.54x | $235.5M | $92.8M |
| 9 | Delaware | 2.54x | $306.9M | $120.9M |
| 10 | West Virginia | 2.39x | $828.5M | $346.7M |
New Jersey’s highway users contribute $965.9 million to the federal Highway Trust Fund and receive $1.32 billion back, a return of $1.36 for every dollar paid in. That $352.2 million net surplus is notable, but it represents a small fraction of New Jersey’s $9.75 billion total highway budget.
Detailed Methodology
This analysis examined federal highway funding flows across all 50 U.S. states using 2024 data from the Federal Highway Administration. Five core data points were collected for each state: federal funds received, total highway receipts, state highway-user revenue, Highway Trust Fund contributions, and public road mileage. The federal dependency percentage was calculated by dividing federal funds received by total highway receipts. Net Federal balance was determined by subtracting each state’s HTF contribution from its federal funds received, with positive values showing a net surplus and negative values showing a net deficit. Donor Ratio was computed by dividing federal funds received by HTF contribution, where values above 1.00x identify net recipients and values below 1.00x identify net donors. Road mileage data was used to calculate federal spending per road mile for each state.
Data Sources:
• FHWA Table SF-1 (2024): Revenues Used by States for Highways
◦ HTML: https://www.fhwa.dot.gov/policyinformation/statistics/2024/sf1.cfm
◦ Excel: https://www.fhwa.dot.gov/policyinformation/statistics/2024/xls/sf1.xlsx
• FHWA Table FE-9 (2024): Federal Highway Trust Fund Receipts Attributable to Highway Users in Each State
◦ HTML: https://www.fhwa.dot.gov/policyinformation/statistics/2024/fe9.cfm
◦ Excel: https://www.fhwa.dot.gov/policyinformation/statistics/2024/xls/fe9.xlsx
• FHWA Table HM-20 (2024): Public Road Length by Functional System
◦ HTML: https://www.fhwa.dot.gov/policyinformation/statistics/2024/hm20.cfm
◦ Excel: https://www.fhwa.dot.gov/policyinformation/statistics/2024/xls/hm20.xlsx
• Research Dataset: https://docs.google.com/spreadsheets/d/1ZuFUsc_xdkUZ01krihX2v1iNZG8b8PkaPq_GBo80sKk/edit?gid=0#gid=0
• Research by: https://kuzyklaw.com/bakersfield/
About Kuzyk Personal Injury & Car Accident Lawyers
Kuzyk Personal Injury & Car Accident Lawyers is a California-based personal injury law firm specializing in intersection accidents and traffic-injury cases. The firm represents victims of negligent driving and unsafe roadway design while using data-driven research to inform public discussion and promote safer transportation systems nationwide.