
Key Highlights
- New Jersey ranks 3rd in the nation for ‘super-drunk’ driving with a Super-Drunk Share of 167.17% from 2020 to 2024, 33 percentage points above the lowest-ranked state, North Dakota (134.17%).
- From 2020 to 2024, New Jersey recorded 466 total fatal crashes involving drivers with a BAC ≥ 0.15 and 779 total fatal crashes involving drivers with a BAC ≥ 0.08, averaging 93.2 and 155.8 per year respectively.
- New Jersey’s Super-Drunk Share of 167.17% places it above Vermont (163.64%) and just below New Hampshire (168.38%) in the national ranking.
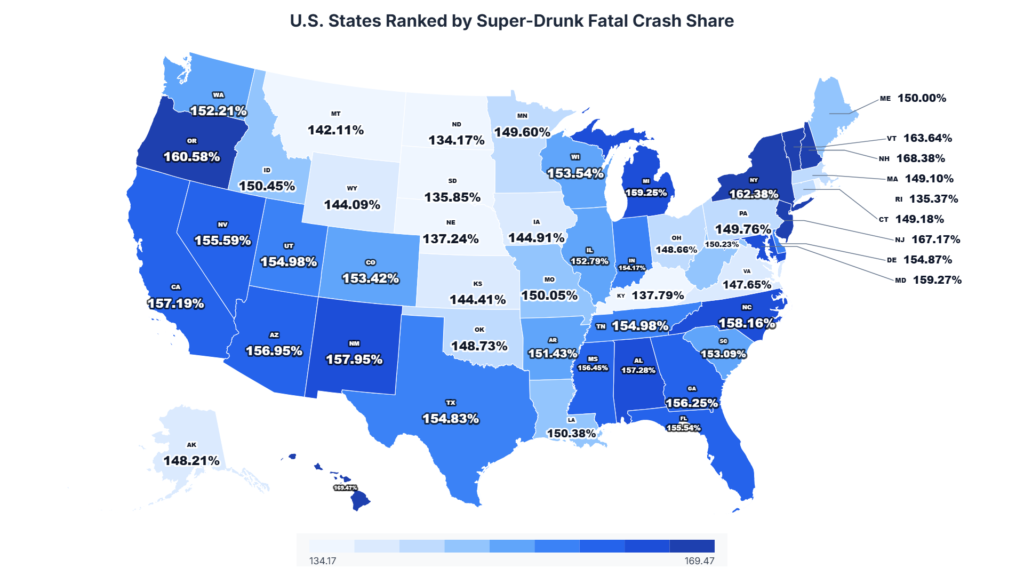
Driving under the influence is dangerous at any BAC level, but “super-drunk” drivers with a BAC of 0.15 or higher are involved in some of the deadliest crashes on the road. Their severely impaired judgment, reaction time, and vehicle control significantly increase the risk of fatal collisions. While every U.S. state has reported alcohol-related traffic deaths, the share involving super-drunk drivers varies widely across the country, and New Jersey ranks among the worst in the nation.
The study conducted by Grigor Law Injury & Car Accident Lawyers analyzed five years (2020–2024) of fatal crash data involving alcohol-impaired drivers from the NHTSA Fatality Analysis Reporting System (FARS). For each state, the total number of fatal crashes involving drivers with a BAC at or above 0.15 (super-drunk) and at or above 0.08 (legally impaired) was collected. A five-year average was calculated for each category, and a Super-Drunk Share was derived to measure the concentration of extreme-BAC crashes among all DUI fatalities. States were ranked from highest to lowest Super-Drunk Share to reveal where the super-drunk driving problem is most severe.
Top 10 States With the Highest Super-Drunk Share
States With the Highest Proportion of Super-Drunk Fatal Crashes (2020–2024 Average)
| Rank | State | Avg. Annual BAC ≥ 0.15 Crashes | Avg. Annual BAC ≥ 0.08 Crashes | Super-Drunk Share (%) |
| 1 | Hawaii | 19.0 | 32.2 | 169.47% |
| 2 | New Hampshire | 23.4 | 39.4 | 168.38% |
| 3 | New Jersey | 93.2 | 155.8 | 167.17% |
| 4 | Vermont | 13.2 | 21.6 | 163.64% |
| 5 | New York | 202.0 | 328.0 | 162.38% |
| 6 | Oregon | 124.8 | 200.4 | 160.58% |
| 7 | Maryland | 114.4 | 182.2 | 159.27% |
| 8 | Michigan | 187.0 | 297.8 | 159.25% |
| 9 | North Carolina | 274.4 | 434.0 | 158.16% |
| 10 | New Mexico | 81.8 | 129.2 | 157.95% |
Hawaii tops the nation with a Super-Drunk Share of 169.47%, meaning its super-drunk fatal crashes are disproportionately high relative to its overall DUI crash totals. New Hampshire (168.38%) and New Jersey (167.17%) follow closely, with Vermont, New York, and Oregon all exceeding 160%.
Looking at the study, Chrissy Grigoropoulos, Founder of Grigor Law Injury & Car Accident Lawyers, Commented:
“Super-drunk driving is a far more dangerous form of impaired driving, with drivers at 0.15 BAC or higher posing an extreme risk on the road. New Jersey’s 3rd ranking in super-drunk crash share is a serious wake-up call for the state. Stronger enforcement and prevention measures are urgently needed. These deaths are preventable, and the data shows that New Jersey is where action is needed most.”
New Jersey at a Glance: Super-Drunk Driving Data (2020–2024)
New Jersey’s Complete Super-Drunk Fatal Crash Data (2020–2024)
| Rank | State | Total BAC ≥ 0.15 (2020–2024) | Total BAC ≥ 0.08 (2020–2024) | Avg. Annual BAC ≥ 0.15 | Avg. Annual BAC ≥ 0.08 | Super-Drunk Share (%) |
| 3 | New Jersey | 466 | 779 | 93.2 | 155.8 | 167.17% |
New Jersey recorded 466 fatal crashes involving super-drunk drivers (BAC ≥ 0.15) and 779 fatal crashes involving legally impaired drivers (BAC ≥ 0.08) over the five-year study period. That translates to an average of 93.2 super-drunk fatal crashes and 155.8 alcohol-impaired fatal crashes per year. New Jersey’s resulting Super-Drunk Share of 167.17% is the 3rd-highest of any state in the nation, meaning that super-drunk crashes make up a disproportionately large share of all DUI fatalities in the state. By comparison, the national lowest is North Dakota at 134.17%, a gap of 33 percentage points.
Methodology
This study analyzed 2020–2024 NHTSA Fatality Analysis Reporting System (FARS) data on alcohol-related fatal crashes across all 50 U.S. states. It compared fatal crashes involving drivers with BAC ≥ 0.15 (“super-drunk”) against those with BAC ≥ 0.08, calculated each state’s Super-Drunk Share, and ranked states accordingly. FHWA licensed driver data was also used for additional context.
Data Sources
Alcohol-Impaired Fatal Crash Data: https://www-fars.nhtsa.dot.gov/States/StatesAlcohol.aspx
Licensed Driver Data: https://www.fhwa.dot.gov/policyinformation/statistics/2022/dl1c.cfm
Research Dataset: https://docs.google.com/spreadsheets/d/1FSYPkf7GdLWGxzj5kF8b7M3xM4aa1JhlPaBXkEZtpTk/edit?gid=0#gid=0
Study By: https://grigorlaw.com
About Grigor Law Injury & Car Accident Lawyers
Grigor Law Injury & Car Accident Lawyers represents injured individuals and their families in serious personal injury and car accident cases across the United States. The firm produces data-driven research to inform policymakers, journalists, and communities on highway safety.